Home Of Fair Facts & Tips
RBA Cash Rate Tracker: Dates and Forecasts
Track the RBA cash rate, meeting dates and big bank forecasts. See what it could mean for your home loan rate.
Next RBA Meeting for 2026: Tuesday, 5th May 2026

Navigate this Article
Cash Rate movements over 15 years
Major Bank Rate Forecasts
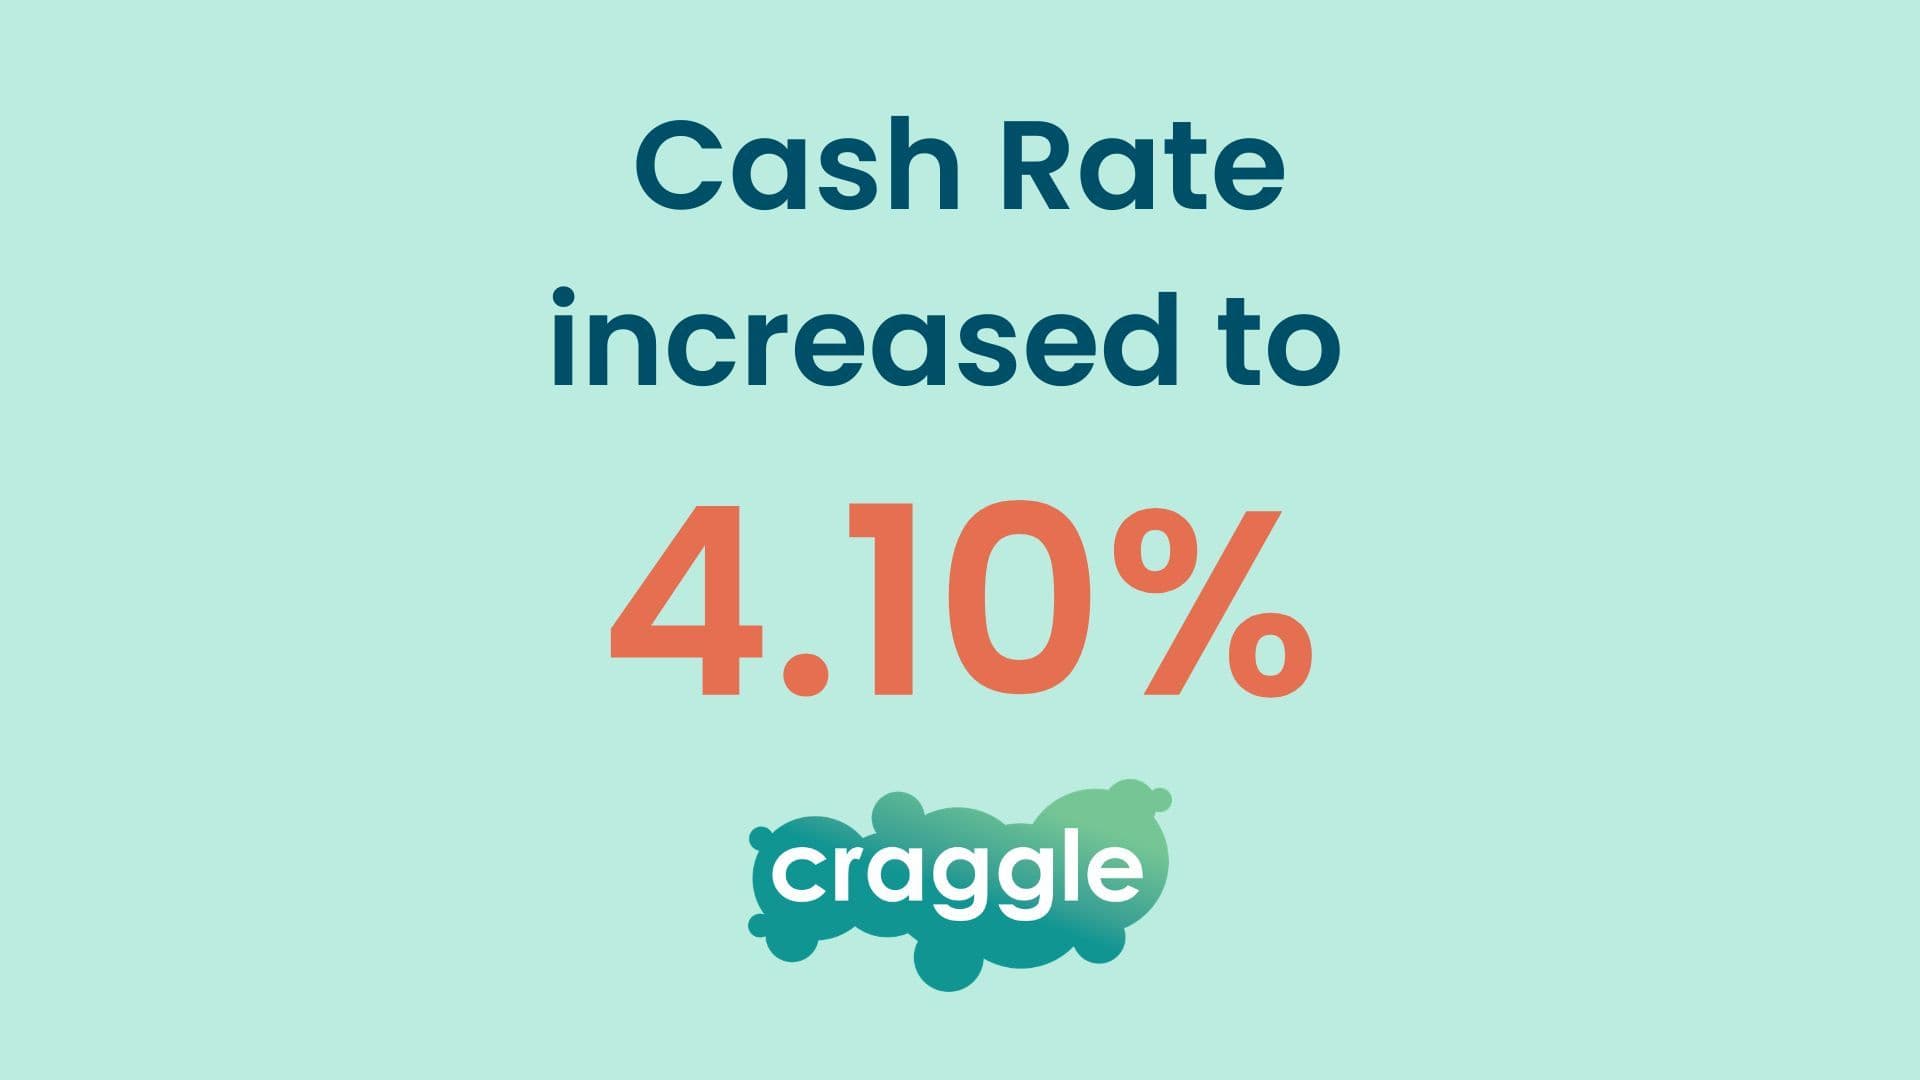
At 17 March 2026 (Sydney time), the Reserve Bank of Australia increased the cash rate target by 25 basis points to 4.10% [RBA-1]. The next cash rate decision is scheduled for 5 May 2026, following the Board meeting on 4 and 5 May 2026, with decisions announced at 2:30 pm (Sydney time) [RBA-2].
Since the move to 4.10%, the Big Four banks are broadly aligned that the next big question is whether the RBA needs to tighten again in May 2026, but they differ on how confident they are. Westpac and CBA both describe May as possible but not guaranteed, noting the Board’s split vote and the importance of what happens next with inflation, fuel prices and household spending [WBC-1][CBA-1]. NAB is firmer, continuing to expect another increase in May and warning that further rises could be needed if inflation stays stubborn [NAB-1]. ANZ’s recent commentary also points to May as the next likely step, with strong growth and a tight labour market keeping pressure on the RBA [ANZ-1]. For borrowers, the key message is that rates have moved higher twice in early 2026, and May is now the main focus for forecasts [RBA-1][WBC-1][CBA-1][NAB-1][ANZ-1].
| Bank | Next Move Timing | Predicting Cuts or Rises In | Cash Rate Forecast (end-2025 or early-2026) |
|---|---|---|---|
| ANZ | May 2026 (expected) | Rise expected in May (25 bp) | 4.35% after a May increase (as indicated in recent commentary) |
| Commonwealth Bank | May 2026 (possible) | Rise possible in May (25 bp) | 4.35% if a May increase occurs; CBA describes it as a close call |
| NAB | May 2026 (expected) | Rise expected in May (25 bp) | 4.35% after a May increase; NAB says risks could be higher |
| Westpac | May 2026 (expected) | Rise expected in May (25 bp), though less certain after the split vote | 4.35% after a May increase (Westpac’s stated base case) |
Per bank quotes
- ANZ: Adam Boyton, Head of Australian Economics, ANZ, 18 March 2026: “Adam expects the RBA to hike again in May.” [ANZ-1]
- Commonwealth Bank: Belinda Allen, Head of Australian Economics, Commonwealth Bank, 17 March 2026: “Our call of a rate hike in May is another line ball decision.” [CBA-1]
- NAB: NAB Economics (note from the Chief Economist, Australia), NAB, 17 March 2026: “NAB continues to expect a further interest rate rise in May.” [NAB-1]
- Westpac: Luci Ellis, Chief Economist, Westpac Group, 17 March 2026: “We therefore retain a May hike as our base case.” [WBC-1]
Major Bank Predictions
What’s Driving the Latest Forecasts?
Inflation and RBA Guidance
Inflation is the centre of the RBA’s current stance. The ABS reported annual CPI inflation of 3.8% in the year to January 2026, with trimmed mean inflation at 3.4% [ABS-1]. In its 17 March 2026 statement, the RBA said inflation “picked up materially in the second half of 2025” and that some of the increase reflects “greater capacity pressures” [RBA-1]. The statement also highlighted sharply higher fuel prices linked to the Middle East conflict and noted short-term inflation expectations have already risen [RBA-1]. Put simply, the RBA is signalling it does not want inflation to stay above target for longer than necessary, even if that means holding rates higher for longer or lifting them again [RBA-1][CBA-1].
Labour Market, Wages, Productivity Growth and Sentiment
The jobs market remains a key reason the RBA and bank economists are cautious about declaring victory on inflation. The ABS reported the unemployment rate was 4.1% in January 2026 (seasonally adjusted), with full-time employment rising and underemployment at 5.9% [ABS-2]. The RBA described labour market conditions as “a little tight” and linked this to its view that capacity pressures are stronger than previously assessed [RBA-1]. For borrowers, this matters because a tight labour market can support wage growth and spending, which can keep inflation higher for longer. That is why most major bank commentary frames May as live, even if not guaranteed [RBA-1][WBC-1][NAB-1].
Housing Pulse
Housing conditions continue to matter because they influence both household finances and broader demand. PropTrack reported national home prices rose 0.5% in February 2026, with the national median home value at $897,000, and annual growth at 9.1% [PROP-1]. Capital city prices also rose 0.5% in February, with the capital-city median home value lifting above $1,000,000 [PROP-1]. In the March decision commentary, NAB noted some moderation in house price growth alongside a modest tightening in financial conditions, but still highlighted domestic capacity pressures as a key theme [NAB-1]. If listings remain tight, even small shifts in borrowing power can change competition quickly in some suburbs [PROP-1][WBC-1].
Risks
- Inflation stays above target for longer, especially if fuel and other costs push up short-term inflation expectations [RBA-1].
- Domestic demand remains stronger than expected, keeping capacity pressures elevated and leaving the RBA less comfortable holding steady [RBA-1][CBA-1].
- A tight labour market keeps wage and services inflation sticky, delaying any easing window [ABS-2][RBA-1].
- Housing prices keep rising in a low-supply market, supporting demand and limiting affordability improvements even if rates stabilise [PROP-1].
Latest Decision: RBA Hike to 4.10%
At its meeting on 17 March 2026, the RBA increased the cash rate target by 25 basis points to 4.10% [RBA-1]. The Bank pointed to inflation that “picked up materially” in the second half of 2025, evidence of greater capacity pressures, and the inflation risk from sharply higher fuel prices [RBA-1]. A key line from the statement was that there is a “material risk that inflation will remain above target for longer than previously anticipated” [RBA-1]. The decision was not unanimous, with a 5 to 4 vote, which helps explain why some banks describe the outlook from here as finely balanced [RBA-1][CBA-1].
The next cash rate decision is scheduled for 5 May 2026, with the Board meeting on 4 and 5 May 2026 and the outcome announced at 2:30 pm (Sydney time) [RBA-2]. Between now and then, the RBA has signalled it will focus on domestic demand, inflation and labour market data, as well as global conditions [RBA-1].
What This Means for Homeowners and Buyers
Variable-Rate Borrowers
Rate rises matter most for variable-rate loans because lenders often pass them through relatively quickly, but timing and size can vary. As a guide, a 25 bp move can change repayments on a $600,000, 30-year principal and interest loan by around $90 per month (the exact impact depends on your rate and remaining term) [NEWS-1]. If you are feeling the squeeze, focus on the basics that can make a real difference: keeping your offset balance working, checking whether your discount has expired, and confirming the true cost of your loan once fees are included [ASIC-3][ASIC-1].
Fixed-Rate Borrowers
If you are on a fixed rate, your repayment usually stays the same until the fixed period ends, even when the cash rate moves. The key risk is what happens at rollover. Many fixed loans revert to a higher variable rate unless you renegotiate or switch, so it can pay to compare options well before the expiry date [ASIC-3]. In a market where another move in May is being discussed, fixed-rate pricing can shift quickly, so check both the headline rate and the comparison rate to understand the true cost [ASIC-2]. Keep an eye on fees or break costs if you are changing a fixed portion early [ASIC-3].
Prospective Buyers
Higher rates can reduce borrowing capacity because lenders test your ability to repay at higher assessment rates, not just today’s market rate. That can lower the maximum you can borrow, even if your income has not changed. At the same time, competition can remain intense if listings are limited, which can keep prices firmer than many buyers expect [PROP-1]. In practice, that means two things can happen at once: your borrowing power can tighten, while the best properties still attract strong interest. If you are buying, keep pre-approval current, build buffers for costs, and be realistic about the price range you can comfortably sustain [PROP-1][ASIC-4].
Refinancers
Refinancing can be worthwhile even when the cash rate is rising, because lender pricing often differs significantly between new and existing customers. Use the comparison rate to compare the true cost of loans because it includes the interest rate and most fees and charges in a single figure [ASIC-2]. Also check your revert rate if you are coming off a fixed term, since that can be well above competitive offers [ASIC-3]. Pricing is often LVR-based, with sharper rates at lower LVR bands and step-ups above key thresholds. Finally, add up the costs: discharge fees, application fees, valuation fees, and any package fees, then weigh them against the potential rate difference [ASIC-4].
Savings and Term Deposit Holders
Higher cash rates can support deposit rates, but pass-through is not automatic and is often uneven across products. Bonus saver accounts may have conditions, such as monthly deposit minimums and limits on withdrawals, so it is worth checking the fine print [ASIC-4]. For term deposits, rate changes can show up quickly in new offers, which can create reinvestment risk if you have a large amount maturing at once. A simple approach is to stagger maturities so you are not forced to re-lock everything on one day at whatever rate happens to be available then [ASIC-4].
Economic Context
The March 2026 decision reflects a clear concern that inflation could stay above target longer than expected. The ABS reported CPI inflation of 3.8% in the year to January 2026, with trimmed mean inflation at 3.4%, both above the RBA’s target band [ABS-1]. The labour market has also stayed firm, with unemployment at 4.1% in January 2026 [ABS-2]. On the housing side, prices rose again in February and annual growth remained strong, which can support demand even as borrowing capacity is constrained [PROP-1]. This is why the debate has shifted from “cuts” to how long policy needs to stay restrictive, and whether another increase is needed in May [RBA-1][WBC-1][NAB-1].
Recent Policy Changes
Sources (updated 18 Mar 2026 AEST):
RBA
- RBA-1 — Statement by the Monetary Policy Board: Monetary Policy Decision. RBA — 17 Mar 2026. https://www.rba.gov.au/media-releases/2026/mr-26-08.html
- RBA-2 — 2026 Monetary Policy Board Meeting Dates. RBA — 10 Feb 2025. https://www.rba.gov.au/media-releases/2025/mr-25-02.html
ABS/Data
- ABS-1 — Consumer Price Index, Australia (reference period January 2026). ABS — 25 Feb 2026. https://www.abs.gov.au/statistics/economy/price-indexes-and-inflation/consumer-price-index-australia/latest-release
- ABS-2 — Labour Force, Australia (reference period January 2026). ABS — 19 Feb 2026. https://www.abs.gov.au/statistics/labour/employment-and-unemployment/labour-force-australia/latest-release
- PROP-1 — PropTrack Home Price Index: February 2026. realestate.com.au (PropTrack) — 2 Mar 2026. https://www.realestate.com.au/insights/proptrack-home-price-index-february-2026/
Major Banks
- WBC-1 — RBA hikes cash rate to 4.1% in split decision. Westpac IQ — 17 Mar 2026. https://www.westpaciq.com.au/economics/2026/03/rba-decision-17-march-2026
- CBA-1 — RBA's only question was when, not if. Commonwealth Bank Newsroom — 17 Mar 2026. https://www.commbank.com.au/articles/newsroom/2026/03/rba-rates-increase-analysis.html
- NAB-1 — Note from NAB's Chief Economist - AUS: RBA means business. NAB News — 17 Mar 2026. https://news.nab.com.au/tag/interest-rates/note-from-nab-s-chief-economist---aus--rba-means-business
- ANZ-1 — Wednesday: RBA hikes; another expected (5 in 5 with ANZ). Substack (ANZ-branded newsletter) — 18 Mar 2026. https://5in5withanz.substack.com/p/wednesday-rba-hikes-another-expected
Government/Policy
- POL-NA — No qualifying home buyer grant or stamp duty change within 5 months from official sources was confirmed for this update. (Not used in body tags.)
Other
- NEWS-1 — RBA hikes rates but not aiming to put Australia into recession, Bullock says. The Guardian — 17 Mar 2026. https://www.theguardian.com/australia-news/2026/mar/17/rba-interest-rate-australia-increase-fuel-petrol-prices
- ASIC-1 — Mortgage calculator. ASIC MoneySmart — accessed 18 Mar 2026. https://moneysmart.gov.au/home-loans/mortgage-calculator
- ASIC-2 — Comparison rate (glossary). ASIC MoneySmart — accessed 18 Mar 2026. https://moneysmart.gov.au/glossary/comparison-rate
- ASIC-3 — Switching home loans. ASIC MoneySmart — accessed 18 Mar 2026. https://moneysmart.gov.au/home-loans/switching-home-loans
- ASIC-4 — Choosing a home loan. ASIC MoneySmart — accessed 18 Mar 2026. https://moneysmart.gov.au/home-loans/choosing-a-home-loan
How Long Does It Take for Lenders to Apply New Rates?
Firstly, it’s important to understand that your lender is not obligated to adjust their interest rates in line with changes to the RBA Cash Rate. While many lenders do follow the RBA’s lead, how and when they do so can vary significantly.
When the RBA Increases the Cash Rate
In the case of rate hikes, lenders are legally required to provide at least 20 days’ notice before increasing your interest rate. This notice must include the following details:
- What your new interest rate will be
- What your new repayment amount will be
- The date the changes will take effect
This requirement is designed to give borrowers time to prepare for the higher repayments and make any necessary financial adjustments.
When the RBA Cuts the Cash Rate
In contrast, there is no obligation for lenders to provide notice when passing on a rate cut. Each lender decides if, when, and how much of the rate cut they will apply. Some may choose to pass on the full cut, others only a portion — and the timing can vary.
For example, following the February 2025 RBA rate cut, effective dates ranged from the same day as the RBA announcement to up to three weeks later. Most lenders applied their announced rate cut approximately two weeks after the RBA decision.
This lack of consistency means it’s important for borrowers to actively monitor their lender’s updates and assess whether they’re getting a fair deal — especially during periods of economic change.
RBA meeting dates for 2026
2025 Reserve Bank Board meetings
- January – No meeting
- 2-3 February
- 16-17 March
- April – No meeting
- 4-5 May
- 15-16 June
- July – No meeting
- 10-11 August
- 28-29 September
- October – No meeting
- 2-3 November
- 7-8 December
What time does the RBA announce the Cash Rate change?
The Reserve Bank Board announces monetary policy decisions, cash rate changes, at ~2.30pm AEDT in a media release after each meeting.What is the RBA Cash Rate?
At its core, the cash rate is the interest rate charged on overnight loans between financial institutions. It’s a powerful lever that the Reserve Bank of Australia (RBA) adjusts to control economic activity, manage inflation, and influence employment rates.A lower cash rate can stimulate spending and investment by making loans cheaper, whereas a higher rate can cool down an overheating economy by making borrowing more expensive.
The history of Australia’s cash rate is a narrative of strategic economic management through diverse global and local challenges. It charts a course through times of boom and bust, revealing how monetary policy has adapted to maintain stability and promote growth.
RBA Rate Tracker – 2026
| Effective Date | Cash Rate (%) | Change % points |
|---|---|---|
| Jan-25 | 3.6 | (No RBA Meeting) |
| Feb-25 | 3.85 | +0.25 |
| Mar-25 | 4.10 | +0.25 |
| Apr-25 | (No RBA Meeting) | |
| May-25 | ||
| Jun-25 | ||
| Jul-25 | (No RBA Meeting) | |
| Aug-26 | ||
| Sep-26 | ||
| Oct-26 | (No RBA Meeting) | |
| Nov-26 | ||
| Dec-26 |

Historical Overview of the Australian Cash Rate
Early Years: The Foundation and Initial Fluctuations
The inception of the cash rate as a tool for monetary policy dates back to the early days of the Reserve Bank of Australia’s establishment in 1960. Initially, the focus was on maintaining currency stability and supporting full employment. However, as the global and domestic economic landscapes evolved, so did the objectives and strategies around the cash rate.
The Turn of the Century: A New Economic Era
The turn of the century marked a period of significant change for Australia’s economy, influenced by both global and domestic factors. The Asian Financial Crisis of the late 1990s, the Dot-com bubble burst, and the Global Financial Crisis (GFC) of 2008–2009 were pivotal events that tested and shaped the RBA cash rate and monetary policies.
2010–2019: Navigating Modern Challenges
Between 2010 and 2019, the Australian economy experienced ongoing challenges, including fluctuating commodity prices and shifts in global trade. During this period, the Reserve Bank took a measured approach to setting the cash rate, aiming to balance inflation targets with growth objectives. This underscored the RBA’s commitment to stabilising the economy despite global headwinds and domestic policy considerations.
2020 to Today: Responding to Unprecedented Disruptions
From 2020 onward, the Australian economy faced unprecedented disruptions, primarily driven by the global COVID-19 pandemic. In response, the RBA introduced additional policy measures and reduced the cash rate to record lows. These actions underscored the flexibility and adaptability of monetary policy in mitigating immediate economic fallout while laying the groundwork for a sustained recovery.
RBA Rate History: 2020-2025
RBA Rate Tracker – 2025
| Effective Date | Cash Rate (%) | Change % points |
|---|---|---|
| Jan-25 | 4.35 | (No RBA Meeting) |
| Feb-25 | 4.1 | -0.25 |
| Mar-25 | 4.1 | - |
| Apr-25 | 4.1 | - |
| May-25 | 3.85 | -0.25 |
| Jun-25 | 3.85 | - |
| Jul-25 | 3.85 | (No RBA Meeting) |
| Aug-25 | 3.60 | -0.25 |
| Sep-25 | 3.6 | - |
| Oct-25 | 3.6 | (No RBA Meeting) |
| Nov-25 | 3.6 | - |
| Dec-25 | 3.6 | - |
RBA Cash Rate History: 2020-2025
RBA Rate Tracker – 2024
| Effective Date | Cash Rate (%) | Change % points |
|---|---|---|
| Jan-24 | 4.35 | - |
| Feb-24 | 4.35 | - |
| Mar-24 | 4.35 | - |
| Apr-24 | 4.35 | (No RBA Meeting) |
| May-24 | 4.35 | - |
| Jun-24 | 4.35 | - |
| Jul-24 | 4.35 | (No RBA Meeting) |
| Aug-24 | 4.35 | - |
| Sep-24 | 4.35 | - |
| Oct-24 | 4.35 | (No RBA Meeting) |
| Nov-24 | 4.35 | - |
| Dec-24 | 4.35 | - |
RBA Cash Rate History: 2020-2025
RBA Rate Tracker – 2023
| Effective Date | Cash Rate (%) | Change % points |
|---|---|---|
| Jan-23 | 3.10 | - |
| Feb-23 | 3.35 | 0.25 |
| Mar-23 | 3.6 | 0.25 |
| Apr-23 | 3.6 | - |
| May-23 | 3.85 | 0.25 |
| Jun-23 | 4.1 | 0.25 |
| Jul-23 | 4.1 | - |
| Aug-23 | 4.1 | - |
| Sep-23 | 4.1 | - |
| Oct-23 | 4.1 | - |
| Nov-23 | 4.35 | 0.25 |
| Dec-23 | 4.35 | - |
RBA Cash Rate History: 2020-2025
RBA Rate Tracker – 2022
| Effective Date | Cash Rate (%) | Change % points |
|---|---|---|
| Jan-22 | 0.1 | - |
| Feb-22 | 0.1 | - |
| Mar-22 | 0.1 | - |
| Apr-22 | 0.1 | - |
| May-22 | 0.35 | 0.25 |
| Jun-22 | 0.85 | 0.5 |
| Jul-22 | 1.35 | 0.5 |
| Aug-22 | 1.85 | 0.5 |
| Sep-22 | 2.35 | 0.5 |
| Oct-22 | 2.6 | 0.25 |
| Nov-22 | 2.85 | 0.25 |
| Dec-22 | 3.1 | 0.25 |
RBA Cash Rate History: 2020-2025
RBA Rate Tracker – 2021
| Effective Date | Cash Rate (%) | Change % points |
|---|---|---|
| Jan-21 | 0.1 | - |
| Feb-21 | 0.1 | - |
| Mar-21 | 0.1 | - |
| Apr-21 | 0.1 | - |
| May-21 | 0.1 | - |
| Jun-21 | 0.1 | - |
| Jul-21 | 0.1 | - |
| Aug-21 | 0.1 | - |
| Sep-21 | 0.1 | - |
| Oct-21 | 0.1 | - |
| Nov-21 | 0.1 | - |
| Dec-21 | 0.1 | - |
RBA Cash Rate History: 2020-2025
RBA Rate Tracker – 2020
| Effective Date | Cash Rate (%) | Change % points |
|---|---|---|
| Jan-20 | 0.75 | - |
| Feb-20 | 0.75 | - |
| Mar-20 | 0.5 | -0.25 |
| Mar-20 | 0.25 | -0.25 |
| Apr-20 | 0.25 | - |
| May-20 | 0.25 | - |
| Jun-20 | 0.25 | - |
| Jul-20 | 0.25 | - |
| Aug-20 | 0.25 | - |
| Sep-20 | 0.25 | - |
| Oct-20 | 0.25 | - |
| Nov-20 | 0.1 | -0.15 |
| Dec-20 | 0.1 | - |
RBA Cash Rate History: 2020-2025
RBA Cash Rate History: 2010-2019
Return to topRBA Rate Tracker –2019
| Effective Date | Cash Rate (%) | Change % points |
|---|---|---|
| Jan-19 | 1.5 | - |
| Feb-19 | 1.5 | - |
| Mar-19 | 1.5 | - |
| Apr-19 | 1.5 | - |
| May-19 | 1.5 | - |
| Jun-19 | 1.25 | -0.25 |
| Jul-19 | 1 | -0.25 |
| Aug-19 | 1 | - |
| Sep-19 | 1 | - |
| Oct-19 | 0.75 | -0.25 |
| Nov-19 | 0.75 | - |
| Dec-19 | 0.75 | - |
RBA Rate Tracker –2018
| Effective Date | Cash Rate (%) | Change % points |
|---|---|---|
| Jan-18 | 1.5 | - |
| Feb-18 | 1.5 | - |
| Mar-18 | 1.5 | - |
| Apr-18 | 1.5 | - |
| May-18 | 1.5 | - |
| Jun-18 | 1.5 | - |
| Jul-18 | 1.5 | - |
| Aug-18 | 1.5 | - |
| Sep-18 | 1.5 | - |
| Oct-18 | 1.5 | - |
| Nov-18 | 1.5 | - |
| Dec-18 | 1.5 | - |
RBA Cash Rate History: 2010-2019
RBA Rate Tracker –2017
| Effective Date | Cash Rate (%) | Change % points |
|---|---|---|
| Jan-17 | 1.5 | - |
| Feb-17 | 1.5 | - |
| Mar-17 | 1.5 | - |
| Apr-17 | 1.5 | - |
| May-17 | 1.5 | - |
| Jun-17 | 1.5 | - |
| Jul-17 | 1.5 | - |
| Aug-17 | 1.5 | - |
| Sep-17 | 1.5 | - |
| Oct-17 | 1.5 | - |
| Nov-17 | 1.5 | - |
| Dec-17 | 1.5 | - |
RBA Cash Rate History: 2010-2019
RBA Rate Tracker –2016
| Effective Date | Cash Rate (%) | Change % points |
|---|---|---|
| Jan-16 | 2 | - |
| Feb-16 | 2 | - |
| Mar-16 | 2 | - |
| Apr-16 | 2 | - |
| May-16 | 1.75 | -0.25 |
| Jun-16 | 1.75 | - |
| Jul-16 | 1.75 | - |
| Aug-16 | 1.5 | -0.25 |
| Sep-16 | 1.5 | - |
| Oct-16 | 1.5 | - |
| Nov-16 | 1.5 | - |
| Dec-16 | 1.5 | - |
RBA Cash Rate History: 2010-2019
RBA Rate Tracker –2015
| Effective Date | Cash Rate (%) | Change % points |
|---|---|---|
| Jan-15 | 2 | - |
| Feb-15 | 2.25 | -0.25 |
| Mar-15 | 2.25 | - |
| Apr-15 | 2.25 | - |
| May-15 | 2 | -0.25 |
| Jun-15 | 2 | - |
| Jul-15 | 2 | - |
| Aug-15 | 2 | - |
| Sep-15 | 2 | - |
| Oct-15 | 2 | - |
| Nov-15 | 2 | - |
| Dec-15 | 2 | - |
RBA Cash Rate History: 2010-2019
RBA Rate Tracker –2014
| Effective Date | Cash Rate (%) | Change % points |
|---|---|---|
| Jan-14 | 2.5 | - |
| Feb-14 | 2.5 | - |
| Mar-14 | 2.5 | - |
| Apr-14 | 2.5 | - |
| May-14 | 2.5 | - |
| Jun-14 | 2.5 | - |
| Jul-14 | 2.5 | - |
| Aug-14 | 2.5 | - |
| Sep-14 | 2.5 | - |
| Oct-14 | 2.5 | - |
| Nov-14 | 2.5 | - |
| Dec-14 | 2.5 | - |
RBA Cash Rate History: 2010-2019
RBA Rate Tracker –2013
| Effective Date | Cash Rate (%) | Change % points |
|---|---|---|
| Jan-13 | 3 | - |
| Feb-13 | 3 | - |
| Mar-13 | 3 | - |
| Apr-13 | 3 | - |
| May-13 | 2.75 | -0.25 |
| Jun-13 | 2.75 | - |
| Jul-13 | 2.75 | - |
| Aug-13 | 2.5 | -0.25 |
| Sep-13 | 2.5 | - |
| Oct-13 | 2.5 | - |
| Nov-13 | 2.5 | - |
| Dec-13 | 2.5 | - |
RBA Cash Rate History: 2010-2019
RBA Rate Tracker –2012
| Effective Date | Cash Rate (%) | Change % points |
|---|---|---|
| Jan-12 | 4.25 | - |
| Feb-12 | 4.25 | - |
| Mar-12 | 4.25 | - |
| Apr-12 | 4.25 | - |
| May-12 | 3.75 | -0.5 |
| Jun-12 | 3.5 | -0.25 |
| Jul-12 | 3.5 | - |
| Aug-12 | 3.5 | - |
| Sep-12 | 3.5 | - |
| Oct-12 | 3.25 | -0.25 |
| Nov-12 | 3.25 | - |
| Dec-12 | 3 | -0.25 |
RBA Cash Rate History: 2010-2019
RBA Rate Tracker –2011
| Effective Date | Cash Rate (%) | Change % points |
|---|---|---|
| Jan-11 | 4.75 | - |
| Feb-11 | 4.75 | - |
| Mar-11 | 4.75 | - |
| Apr-11 | 4.75 | - |
| May-11 | 4.75 | - |
| Jun-11 | 4.75 | - |
| Jul-11 | 4.75 | - |
| Aug-11 | 4.75 | - |
| Sep-11 | 4.75 | - |
| Oct-11 | 4.75 | - |
| Nov-11 | 4.5 | -0.25 |
| Dec-11 | 4.25 | -0.25 |
RBA Cash Rate History: 2010-2019
RBA Rate Tracker –2010
| Effective Date | Cash Rate (%) | Change % points |
|---|---|---|
| Jan-10 | 3.75 | - |
| Feb-10 | 3.75 | - |
| Mar-10 | 4 | 0.25 |
| Apr-10 | 4.25 | 0.25 |
| May-10 | 4.5 | 0.25 |
| Jun-10 | 4.5 | - |
| Jul-10 | 4.5 | - |
| Aug-10 | 4.5 | - |
| Sep-10 | 4.5 | - |
| Oct-10 | 4.5 | - |
| Nov-10 | 4.75 | 0.25 |
| Dec-10 | 4.75 | - |
The 2000s: Stability and Growth
The early 2000s were characterised by economic stability and growth, but the GFC presented unprecedented challenges. Australia's cash rate saw significant adjustments as the RBA aimed to shield the economy from the worst impacts of the crisis.
RBA Cash Rate History: 2000-2009
Return to topRBA Rate Tracker – 2009
| Effective Date | Cash Rate (%) | Change % points |
|---|---|---|
| Jan-09 | 4.25 | - |
| Feb-09 | 3.25 | -1 |
| Mar-09 | 3.25 | - |
| Apr-09 | 3 | -0.25 |
| May-09 | 3 | - |
| Jun-09 | 3 | - |
| Jul-09 | 3 | - |
| Aug-09 | 3 | - |
| Sep-09 | 3 | - |
| Oct-09 | 3.25 | 0.25 |
| Nov-09 | 3.5 | 0.25 |
| Dec-09 | 3.75 | 0.25 |
RBA Cash Rate History: 2000-2009
RBA Rate Tracker – 2008
| Effective Date | Cash Rate (%) | Change % points |
|---|---|---|
| Jan-08 | 6.75 | - |
| Feb-08 | 7 | 0.25 |
| Mar-08 | 7.25 | 0.25 |
| Apr-08 | 7.25 | - |
| May-08 | 7.25 | - |
| Jun-08 | 7.25 | - |
| Jul-08 | 7.25 | - |
| Aug-08 | 7.25 | - |
| Sep-08 | 7 | -0.25 |
| Oct-08 | 6 | -1 |
| Nov-08 | 5.25 | -0.75 |
| Dec-08 | 4.25 | -1 |
RBA Cash Rate History: 2000-2009
RBA Rate Tracker – 2007
| Effective Date | Cash Rate (%) | Change % points |
|---|---|---|
| Jan-07 | 6.25 | - |
| Feb-07 | 6.25 | - |
| Mar-07 | 6.25 | - |
| Apr-07 | 6.25 | - |
| May-07 | 6.25 | - |
| Jun-07 | 6.25 | - |
| Jul-07 | 6.25 | - |
| Aug-07 | 6.5 | 0.25 |
| Sep-07 | 6.5 | - |
| Oct-07 | 6.5 | - |
| Nov-07 | 6.75 | 0.25 |
| Dec-07 | 6.75 | - |
RBA Cash Rate History: 2000-2009
RBA Rate Tracker – 2006
| Effective Date | Cash Rate (%) | Change % points |
|---|---|---|
| Jan-06 | 5.5 | - |
| Feb-06 | 5.5 | - |
| Mar-06 | 5.5 | - |
| Apr-06 | 5.5 | - |
| May-06 | 5.75 | 0.25 |
| Jun-06 | 5.75 | - |
| Jul-06 | 5.75 | - |
| Aug-06 | 6 | 0.25 |
| Sep-06 | 6 | - |
| Oct-06 | 6 | - |
| Nov-06 | 6.25 | 0.25 |
| Dec-06 | 6.25 | - |
RBA Cash Rate History: 2000-2009
RBA Rate Tracker – 2005
| Effective Date | Cash Rate (%) | Change % points |
|---|---|---|
| Jan-05 | 5.25 | - |
| Feb-05 | 5.25 | - |
| Mar-05 | 5.5 | 0.25 |
| Apr-05 | 5.5 | - |
| May-05 | 5.5 | - |
| Jun-05 | 5.5 | - |
| Jul-05 | 5.5 | - |
| Aug-05 | 5.5 | - |
| Sep-05 | 5.5 | - |
| Oct-05 | 5.5 | - |
| Nov-05 | 5.5 | - |
| Dec-05 | 5.5 | - |
RBA Cash Rate History: 2000-2009
RBA Rate Tracker – 2004
| Effective Date | Cash Rate (%) | Change % points |
|---|---|---|
| Jan-04 | 5.25 | - |
| Feb-04 | 5.25 | - |
| Mar-04 | 5.25 | - |
| Apr-04 | 5.25 | - |
| May-04 | 5.25 | - |
| Jun-04 | 5.25 | - |
| Jul-04 | 5.25 | - |
| Aug-04 | 5.25 | - |
| Sep-04 | 5.25 | - |
| Oct-04 | 5.25 | - |
| Nov-04 | 5.25 | - |
| Dec-04 | 5.25 | - |
RBA Cash Rate History: 2000-2009
RBA Rate Tracker – 2003
| Effective Date | Cash Rate (%) | Change % points |
|---|---|---|
| Jan-03 | 4.75 | - |
| Feb-03 | 4.75 | - |
| Mar-03 | 4.75 | - |
| Apr-03 | 4.75 | - |
| May-03 | 4.75 | - |
| Jun-03 | 4.75 | - |
| Jul-03 | 4.75 | - |
| Aug-03 | 4.75 | - |
| Sep-03 | 4.75 | - |
| Oct-03 | 4.75 | - |
| Nov-03 | 5 | 0.25 |
| Dec-03 | 5.25 | 0.25 |
RBA Cash Rate History: 2000-2009
RBA Rate Tracker – 2002
| Effective Date | Cash Rate (%) | Change % points |
|---|---|---|
| Jan-02 | 4.25 | - |
| Feb-02 | 4.25 | - |
| Mar-02 | 4.25 | - |
| Apr-02 | 4.25 | - |
| May-02 | 4.5 | 0.25 |
| Jun-02 | 4.75 | 0.25 |
| Jul-02 | 4.75 | - |
| Aug-02 | 4.75 | - |
| Sep-02 | 4.75 | - |
| Oct-02 | 4.75 | - |
| Nov-02 | 4.75 | - |
| Dec-02 | 4.75 | - |
RBA Cash Rate History: 2000-2009
RBA Rate Tracker – 2001
| Effective Date | Cash Rate (%) | Change % points |
|---|---|---|
| Jan-01 | 6.25 | - |
| Feb-01 | 5.75 | -0.5 |
| Mar-01 | 5.5 | -0.25 |
| Apr-01 | 5 | -0.5 |
| May-01 | 5 | - |
| Jun-01 | 5 | - |
| Jul-01 | 5 | - |
| Aug-01 | 5 | - |
| Sep-01 | 4.75 | -0.25 |
| Oct-01 | 4.5 | -0.25 |
| Nov-01 | 4.5 | - |
| Dec-01 | 4.25 | -0.25 |
RBA Cash Rate History: 2000-2009
RBA Rate Tracker – 2000
| Effective Date | Cash Rate (%) | Change % points |
|---|---|---|
| Jan-00 | 5 | - |
| Feb-00 | 5.5 | 0.5 |
| Mar-00 | 5.5 | - |
| Apr-00 | 5.75 | 0.25 |
| May-00 | 6 | 0.25 |
| Jun-00 | 6 | - |
| Jul-00 | 6 | - |
| Aug-00 | 6.25 | 0.25 |
| Sep-00 | 6.25 | - |
| Oct-00 | 6.25 | - |
| Nov-00 | 6.25 | - |
| Dec-00 | 6.25 | - |
The 1990s: Economic Reforms and Challenges
This decade was marked by considerable economic reforms, including the floating of the Australian dollar and the deregulation of the financial system. These changes laid the groundwork for a more open and flexible economy but also introduced new challenges, especially during the Asian Financial Crisis.
RBA Cash Rate History: 1990-1999
Return to topRBA Rate Tracker – 1999
| Effective Date | Cash Rate (%) | Change % points |
|---|---|---|
| Jan-99 | 4.75 | - |
| Feb-99 | 4.75 | - |
| Mar-99 | 4.75 | - |
| Apr-99 | 4.75 | - |
| May-99 | 4.75 | - |
| Jun-99 | 4.75 | - |
| Jul-99 | 4.75 | - |
| Aug-99 | 4.75 | - |
| Sep-99 | 4.75 | - |
| Oct-99 | 4.75 | - |
| Nov-99 | 5 | 0.25 |
| Dec-99 | 5 | - |
RBA Cash Rate History: 1990-1999
RBA Rate Tracker – 1998
| Effective Date | Cash Rate (%) | Change % points |
|---|---|---|
| Jan-98 | 0.05 | - |
| Feb-98 | 0.05 | - |
| Mar-98 | 5 | - |
| Apr-98 | 5 | - |
| May-98 | 5 | - |
| Jun-98 | 5 | - |
| Jul-98 | 5 | - |
| Aug-98 | 5 | - |
| Sep-98 | 5 | - |
| Oct-98 | 5 | - |
| Nov-98 | 5 | - |
| Dec-98 | 4.75 | -0.25 |
RBA Cash Rate History: 1990-1999
RBA Rate Tracker – 1997
| Effective Date | Cash Rate (%) | Change % points |
|---|---|---|
| Jan-97 | 6 | - |
| Feb-97 | 6 | - |
| Mar-97 | 6 | - |
| Apr-97 | 6 | - |
| May-97 | 6 | - |
| May-97 | 5.5 | -0.5 |
| Jun-97 | 5.5 | - |
| Jul-97 | 5.5 | - |
| Jul-97 | 5 | -0.5 |
| Aug-97 | 5 | - |
| Sep-97 | 5 | - |
| Oct-97 | 5 | - |
| Nov-97 | 5 | - |
| Dec-97 | 5 | - |
RBA Cash Rate History: 1990-1999
RBA Rate Tracker – 1996
| Effective Date | Cash Rate (%) | Change % points |
|---|---|---|
| Jan-96 | 7.5 | - |
| Feb-96 | 7.5 | - |
| Mar-96 | 7.5 | - |
| Apr-96 | 7.5 | - |
| May-96 | 7.5 | - |
| Jun-96 | 7.5 | - |
| Jul-96 | 7.5 | - |
| Jul-96 | 7 | -0.5 |
| Sep-96 | 7 | - |
| Oct-96 | 7 | - |
| Nov-96 | 6.5 | -0.5 |
| Dec-96 | 6 | -0.5 |
RBA Cash Rate History: 1990-1999
RBA Rate Tracker – 1995
| Effective Date | Cash Rate (%) | Change % points |
|---|---|---|
| Jan-95 | 7.5 | - |
| Feb-95 | 7.5 | - |
| Mar-95 | 7.5 | - |
| Apr-95 | 7.5 | - |
| May-95 | 7.5 | - |
| Jun-95 | 7.5 | - |
| Jul-95 | 7.5 | - |
| Jul-95 | 7.5 | - |
| Sep-95 | 7.5 | - |
| Oct-95 | 7.5 | - |
| Nov-95 | 7.5 | - |
| Dec-95 | 7.5 | - |
RBA Cash Rate History: 1990-1999
RBA Rate Tracker – 1994
| Effective Date | Cash Rate (%) | Change % points |
|---|---|---|
| Jan-94 | 4.75 | - |
| Feb-94 | 4.75 | - |
| Mar-94 | 4.75 | - |
| Mar-94 | 4.75 | - |
| May-94 | 4.75 | - |
| Jun-94 | 4.75 | - |
| Jul-94 | 4.75 | - |
| Jul-94 | 4.75 | - |
| Aug-94 | 5.5 | 0.75 |
| Sep-94 | 5.5 | - |
| Oct-94 | 6.5 | 1 |
| Nov-94 | 6.5 | - |
| Dec-94 | 7.5 | 1 |
RBA Cash Rate History: 1990-1999
RBA Rate Tracker – 1993
| Effective Date | Cash Rate (%) | Change % points |
|---|---|---|
| Jan-93 | 5.75 | - |
| Feb-93 | 5.75 | - |
| Mar-93 | 5.25 | -0.5 |
| Apr-93 | 5.25 | - |
| May-93 | 5.25 | - |
| Jun-93 | 5.25 | - |
| Jul-93 | 5.25 | - |
| Jul-93 | 4.75 | -0.5 |
| Sep-93 | 4.75 | - |
| Oct-93 | 4.75 | - |
| Nov-93 | 4.75 | - |
| Dec-93 | 4.75 | - |
RBA Cash Rate History: 1990-1999
RBA Rate Tracker – 1992
| Effective Date | Cash Rate (%) | Change % points |
|---|---|---|
| Jan-92 | 7.5 | -1 |
| Feb-92 | 7.5 | - |
| Mar-92 | 7.5 | - |
| Apr-92 | 7.5 | - |
| May-92 | 6.5 | -1 |
| Jun-92 | 6.5 | - |
| Jul-92 | 5.75 | -0.75 |
| Jul-92 | 5.75 | - |
| Sep-92 | 5.75 | - |
| Oct-92 | 5.75 | - |
| Nov-92 | 5.75 | - |
| Dec-92 | 5.75 | - |
RBA Cash Rate History: 1990-1999
RBA Rate Tracker – 1991
| Effective Date | Cash Rate (%) | Change % points |
|---|---|---|
| Jan-91 | 12 | - |
| Feb-91 | 12 | - |
| Mar-91 | 12 | - |
| Apr-91 | 11.5 | -0.5 |
| May-91 | 10.5 | -1 |
| Jun-91 | 10.5 | - |
| Jul-91 | 10.5 | - |
| Jul-91 | 10.5 | - |
| Sep-91 | 9.5 | -1 |
| Oct-91 | 9.5 | - |
| Nov-91 | 8.5 | -1 |
| Dec-91 | 8.5 | - |
RBA Cash Rate History: 1990-1999
RBA Rate Tracker – 1990
| Effective Date | Cash Rate (%) | Change % points |
|---|---|---|
| Jan-90 | 17 | -0.5 |
| Feb-90 | 16.5 | -0.5 |
| Mar-90 | 16.5 | - |
| Apr-90 | 15 | -1.5 |
| May-90 | 15 | - |
| Jun-90 | 15 | - |
| Jul-90 | 15 | - |
| Aug-90 | 14 | -1 |
| Sep-90 | 14 | - |
| Oct-90 | 13 | -1 |
| Nov-90 | 13 | - |
| Dec-90 | 12 | -1 |
Factors Influencing Changes in the Cash Rate
Changes in the cash rate are influenced by a variety of factors, including inflation, economic growth, and global economic conditions. The RBA cash rate decisions are aimed at achieving a balance that supports sustainable growth while keeping inflation within target ranges.
The Future of Australia's Cash Rate
Predicting the future direction of the cash rate involves considering current economic indicators, expert forecasts, and global economic trends. While uncertainty is a constant in economic forecasting, understanding the historical context can provide valuable insights into potential future movements.
Conclusion
The historical journey of Australia's cash rate is more than a series of numbers; it's a reflection of the nation's economic resilience and the strategic foresight of its policymakers. As we look towards the future, this history serves as a reminder of the importance of adaptability, sound economic management, and the role of informed policy decisions in navigating the complexities of the global economy.
Disclaimer: The opinions expressed in this article are strictly for general informational and entertainment purposes only and should not be taken as financial advice or recommendations.
Written By

The Craggle Team